3. EXAMPLES
3.1. run_test
Set the run time parameters for MultiNest sampling:
--sampling 1,0,0,200,0.8,0.1,1000,-1e90,1,2,0,0,-1e90,100000,0.01
Set the input file:
-i 0,observation/ULTRAVISTA/test.txt
# ULTRAVISTA0 30 0
#ID z_min z_max E(B-V) Ks eKs H eH J eJ Y eY ch4 ech4 ch3 ech3 ch2 ech2 ch1 ech1 zp ezp ip eip rp erp V eV gp egp B eB u eu IA484 eIA484 IA527 eIA527 IA624 eIA624 IA679 eIA679 IA738 eIA738 IA767 eIA767 IB427 eIB427 IB464 eIB464 IB505 eIB505 IB574 eIB574 IB709 eIB709 IB827 eIB827 fuv efuv nuv enuv mips24 emips24 K_flag K_star K_Kron apcor z_spec z_spec_cc z_spec_id star contamination nan_contam orig_cat_id orig_cat_field USE z ltau metal lage Av lmass lsfr lssfr la2t chi2 ra dec xpix ypix Ks_tot eKs_tot
ULTRAVISTA114558 0.8379 0.8379 0 27.4907 0.584591 21.0782 0.522225 15.6179 0.356165 10.0914 0.313335 25.4707 5.30565 27.0285 6.80395 27.0156 2.81926 34.3339 3.22051 7.86572 0.187851 3.97121 0.0939253 1.48011 0.0736374 0.704697 0.0533496 0.343633 0.0465869 0.214646 0.0315589 0.106576 0.0480897 0.428297 0.123981 0.650911 0.136004 1.56478 0.186348 2.25254 0.184845 3.58026 0.272759 3.78943 0.285533 0.115042 0.0909197 0.217136 0.120224 0.451205 0.140512 1.07821 0.188602 2.6156 0.226172 5.97773 0.365933 -0.127991 0.0916711 0.323215 0.181088 30.3239 5.21473 0.000 0.190 11.84121 1.00093 0.83790 4.50000 823976 0 0 0 35639 5 1 0.8349 8.60 0.020 9.40 0.30 10.60 -0.49 -11.09 0.80 1.71e+00 150.28802 2.1318095 3298.41602 6082.29980 75.711 1.610
ULTRAVISTA99938 0.5532 0.5532 0 7.77833 0.824963 6.39761 0.800201 6.14951 0.577344 6.42505 0.493935 5.36558 5.83991 -0.0146301 7.1562 2.10368 1.65123 3.7008 1.41404 5.15284 0.310176 5.05043 0.169424 3.26739 0.153785 2.022 0.113384 1.4435 0.0912282 1.43131 0.0847119 1.24478 0.213735 1.53555 0.337544 1.68368 0.324512 3.63801 0.428772 4.61091 0.402707 4.69626 0.487419 6.26411 0.555189 1.22832 0.370126 1.68977 0.409223 1.58554 0.381855 2.48041 0.41574 4.01108 0.437895 3.73067 0.47569 0.269437 0.158998 1.31915 0.23198 -60.8977 -130.196 0.000 0.030 14.70963 1.00000 0.55320 4.50000 829240 0 0 0 61860 4 1 0.5493 8.20 0.020 8.70 0.20 9.23 -0.14 -9.37 0.50 2.80e+00 150.58911 2.4122887 6799.39502 12815.56348 21.422 2.272
Set the files for the definition and selection of filters:
--filters observation/ULTRAVISTA/filters.txt --filters_selected observation/ULTRAVISTA/filters_selected.txt
filters.txt
filters_selected.txt
#iused iselected id name information
1 2 225 Ks # 1 0   434 VISTA_Ks  +atm  lambda_c= 2.1487e+04  AB-Vega= xxxx
1 1 224 H # 1 0   382 VISTA_H  +atm  lambda_c= 1.6464e+04  AB-Vega= xxxx
1 1 223 J # 1 0   233 VISTA_J  +atm  lambda_c= 1.2541e+04  AB-Vega= xxxx
1 1 222 Y # 1 0   135 VISTA_Y  +atm  lambda_c= 1.0211e+04  AB-Vega= xxxx
1 0 20 8.0micron # 1 1   158 IRAC/irac_tr4_2004-08-09.dat  8.0micron  lambda_c= 7.9158e+04  AB-Vega= 4.387
1 0 19 5.8micron # 1 1    95 IRAC/irac_tr3_2004-08-09.dat  5.8micron  lambda_c= 5.7450e+04  AB-Vega= 3.747
1 1 18 4.5micron # 1 1    86 IRAC/irac_tr2_2004-08-09.dat  4.5micron  lambda_c= 4.5020e+04  AB-Vega= 3.254
1 1 17 3.6micron # 1 1    94 IRAC/irac_tr1_2004-08-09.dat  3.6micron  lambda_c= 3.5569e+04  AB-Vega= 2.781
1 1 82 z+ # 1 0    81 COSMOS/SUBARU_filter_z.txt     lambda_c= 9.0282e+03  AB-Vega= 0.514
1 1 81 i+ # 1 0    94 COSMOS/SUBARU_filter_i.txt     lambda_c= 7.6712e+03  AB-Vega= 0.380
1 1 80 r+ # 1 0    92 COSMOS/SUBARU_filter_r.txt     lambda_c= 6.2755e+03  AB-Vega= 0.154
1 1 78 Vj # 1 0   107 COSMOS/SUBARU_filter_V.txt     lambda_c= 5.4702e+03  AB-Vega=-0.000
1 1 79 g+ # 1 0   118 COSMOS/SUBARU_filter_g.txt     lambda_c= 4.7609e+03  AB-Vega=-0.101
1 1 77 Bj # 1 0   161 COSMOS/SUBARU_filter_B.txt     lambda_c= 4.4480e+03  AB-Vega=-0.112
1 1 87 u* # 1 0   132 megaprime/cfht_mega_u_cfh9301.dat  CFHT-LS+atm  lambda_c= 3.8280e+03  AB-Vega= 0.325
1 1 183 IA484 # 1 0    32 Subaru_MB/IA484.dat     lambda_c= 4.8473e+03  AB-Vega=-0.037
1 1 185 IA527 # 1 0    35 Subaru_MB/IA527.dat     lambda_c= 5.2593e+03  AB-Vega=-0.035
1 1 189 IA624 # 1 0    33 Subaru_MB/IA624.dat     lambda_c= 6.2308e+03  AB-Vega= 0.142
1 1 191 IA679 # 1 0    39 Subaru_MB/IA679.dat     lambda_c= 6.7816e+03  AB-Vega= 0.245
1 1 193 IA738 # 1 0    32 Subaru_MB/IA738.dat     lambda_c= 7.3595e+03  AB-Vega= 0.334
1 1 194 IA768 # 1 0    28 Subaru_MB/IA768.dat     lambda_c= 7.6804e+03  AB-Vega= 0.387
1 1 180 IA427 # 1 0    39 Subaru_MB/IA427.dat     lambda_c= 4.2600e+03  AB-Vega=-0.161
1 1 182 IA464 # 1 0    28 Subaru_MB/IA464.dat     lambda_c= 4.6333e+03  AB-Vega=-0.167
1 1 184 IA505 # 1 0    34 Subaru_MB/IA505.dat     lambda_c= 5.0608e+03  AB-Vega=-0.077
1 1 187 IA574 # 1 0    42 Subaru_MB/IA574.dat     lambda_c= 5.7629e+03  AB-Vega= 0.054
1 1 192 IA709 # 1 0    33 Subaru_MB/IA709.dat     lambda_c= 7.0735e+03  AB-Vega= 0.287
1 1 196 IA827 # 1 0    25 Subaru_MB/IA827.dat     lambda_c= 8.2468e+03  AB-Vega= 0.475
1 1 119 FUV # 1 0    18 CAPAK/galex1500.res  FUV  lambda_c= 1.5364e+03  AB-Vega= 2.128
1 1 120 NUV # 1 0    27 CAPAK/galex2500.res  NUV  lambda_c= 2.2992e+03  AB-Vega= 1.665
1 0 226 24micron # 1 2 'MIPS_24' (http://irsa.ipac.caltech.edu/data/SPITZER/docs/files/spitzer/MIPSfiltsumm.txt)
2 0 152 U # 1 0    23 REST_FRAME/maiz-apellaniz_Johnson_U.res  2006AJ....131.1184M  lambda_c= 3.5900e+03  AB-Vega= 0.769
2 0 153 B # 1 0    41 REST_FRAME/maiz-apellaniz_Johnson_B.res  2006AJ....131.1184M  lambda_c= 4.3722e+03  AB-Vega=-0.106
2 0 154 V # 1 0    47 REST_FRAME/maiz-apellaniz_Johnson_V.res  2006AJ....131.1184M  lambda_c= 5.4794e+03  AB-Vega= 0.002
2 0 160 J_2mass # 1 0    89 2MASS/J.res     lambda_c= 1.2358e+04  AB-Vega= 0.885
2 0 161 H_2mass # 1 0    58 2MASS/H.res     lambda_c= 1.6458e+04  AB-Vega= 1.362
2 0 162 K_2mass # 1 0    63 2MASS/K.res     lambda_c= 2.1603e+04  AB-Vega= 1.830
Set the SED model (SSP, star-formation histroy and dust extinction law):
--ssp 0,bc2003_lr_BaSeL_chab,1,3,1,0,0,0,0,0 --sfh 0,2,0,0 --ext 0,7
Set output directory of all results:
--outdir test
Set the systematic error in the data as a free parameter:
--sys_err_obs 0,1
Set the allowed redshift range which will override that set in the inputfile:
--zrange 0,6
Save the best-fitting results and the posteriori PDFs of model spectra, SFH, and parameters:
--save_bestfit --save_pos_spec --save_pos_sfh 100 --save_sample_par
Full command to run:
time ./bayesed --sampling 1,0,0,200,0.8,0.1,1000,-1e90,1,2,0,0,-1e90,100000,0.01 -i 0,observation/ULTRAVISTA/test.txt --filters observation/ULTRAVISTA/filters.txt --filters_selected observation/ULTRAVISTA/filters_selected.txt --ssp 0,bc2003_lr_BaSeL_chab,1,3,1,0,0,0,0,0 --sfh 0,2,0,0 --ext 0,7 --outdir test --sys_err_obs 0,1 --zrange 0,6 --save_bestfit --save_pos_spec --save_pos_sfh 100 --save_sample_par
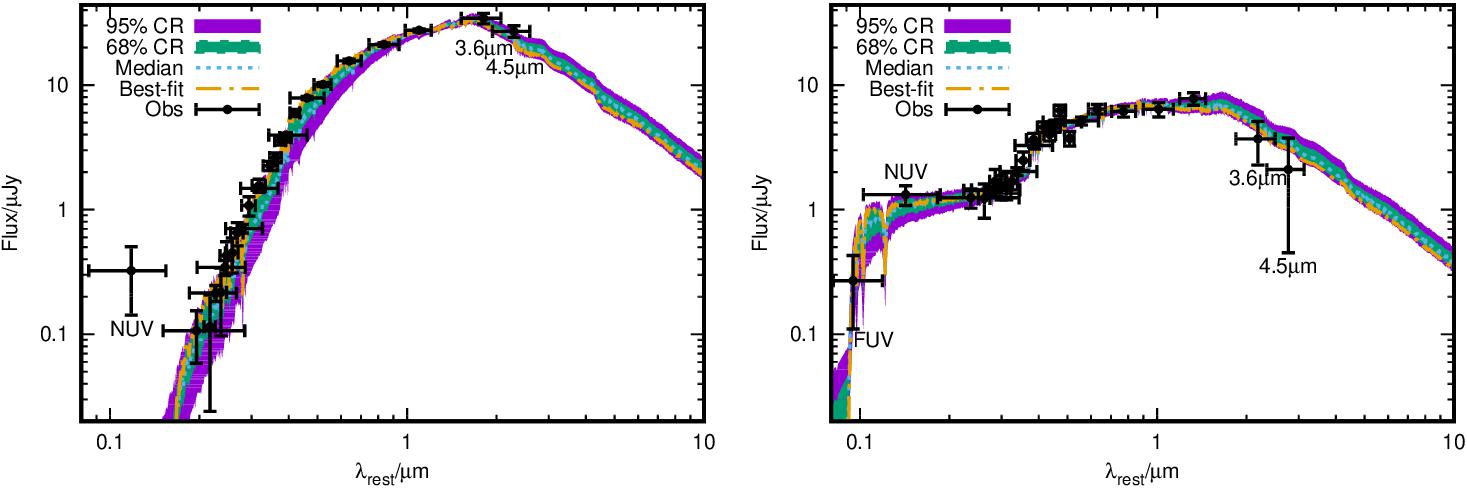
The results of SED fitting for the PEG ULTRAVISTA114558 (left) and the SFG ULTRAVISTA99938 (right). Except for the best-fit SED, the median, 68% and 95% credible region obtained from the posterior PDFs of the model SEDs are also shown. The GALEX FUV and NUV, Spitzer IRAC 3.6 and 4.5um data have been labeled in the figure.
um='{/Symbol m}m'
lam='{/Symbol l}'
uJy='{/Symbol m}Jy'
set log xy 10
set xlabel lam.'_{rest}/'.um
set ylabel 'Flux/'.uJy
set key at 0.35,36 vertical
set xrange [0.08:10]
set yrange [0.02:44]
#set xtics 0.1,0.5,5
set multiplot layout 2,2
set label 'NUV' at 0.118731,0.11 center
set label '3.6'.um at 1.82181,20 center
set label '4.5'.um at 2.30539,14 center
plot 'test/ULTRAVISTA0/ULTRAVISTA114558/10csp200_bc2003_lr_BaSeL_chab000_hyperz5_spectra_pos.txt' u 1:6:7 w filledcurves t '95% CR','' u 1:4:5 w filledcurves t '68% CR','' u 1:3 w l t 'Median','test/ULTRAVISTA0/ULTRAVISTA114558/10csp200_bc2003_lr_BaSeL_chab000_hyperz5_bestfit.txt' index 1 u 1:3 w l t 'Best-fit','' index 0 u 4:($2>0?$9:0/0):3:5:($9-$10):($9+$10) w xye t 'Obs' pt 7 ps 0.7 lt -1
unset label
set label 'FUV' at 0.0942646,0.09 left
set label 'NUV' at 0.14234,2 center
set label '3.6'.um at 2.18407,1.8 center
set label '4.5'.um at 2.7638,0.35 center
plot 'test/ULTRAVISTA0/ULTRAVISTA99938/10csp200_bc2003_lr_BaSeL_chab000_hyperz5_spectra_pos.txt' u 1:6:7 w filledcurves t '95% CR','' u 1:4:5 w filledcurves t '68% CR','' u 1:3 w l t 'Median','test/ULTRAVISTA0/ULTRAVISTA99938/10csp200_bc2003_lr_BaSeL_chab000_hyperz5_bestfit.txt' index 1 u 1:3 w l t 'Best-fit','' index 0 u 4:($2>0?$9:0/0):3:5:($9-$10):($9+$10) w xye t 'Obs' pt 7 ps 0.7 lt -1
unset multiplot
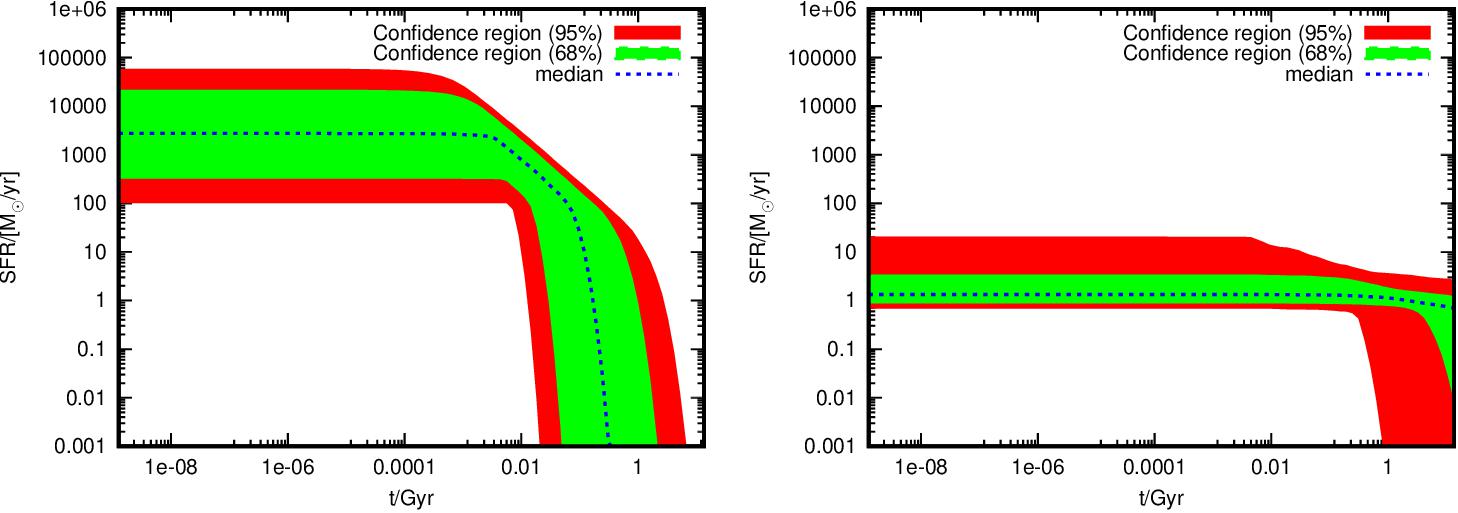
The posterior PDF for the SFH of the PEG ULTRAVISTA114558 (left) and the SFG ULTRAVISTA99938 (right). Only the median, 68% and 95% credible region obtained from the posterior PDF of the SFH for the two galaxies are shown.
Msun='M_{/CMSY10 \014}'
set colorsequence classic
set xlabel 't/Gyr'
set ylabel 'SFR/['.Msun.'/yr]'
set multiplot layout 2,2
set log xy 10
set yrange [1e-3:1e6]
plot 'test/ULTRAVISTA0/ULTRAVISTA114558/10csp200_bc2003_lr_BaSeL_chab000_hyperz5_sfh_pos.txt' u 1:5:6 w filledcurves t 'Confidence region (95%)','' u 1:3:4 w filledcurves t 'Confidence region (68%)','' u 1:2 w l t 'median'
plot 'test/ULTRAVISTA0/ULTRAVISTA99938/10csp200_bc2003_lr_BaSeL_chab000_hyperz5_sfh_pos.txt' u 1:5:6 w filledcurves t 'Confidence region (95%)','' u 1:3:4 w filledcurves t 'Confidence region (68%)','' u 1:2 w l t 'median'
unset multiplot
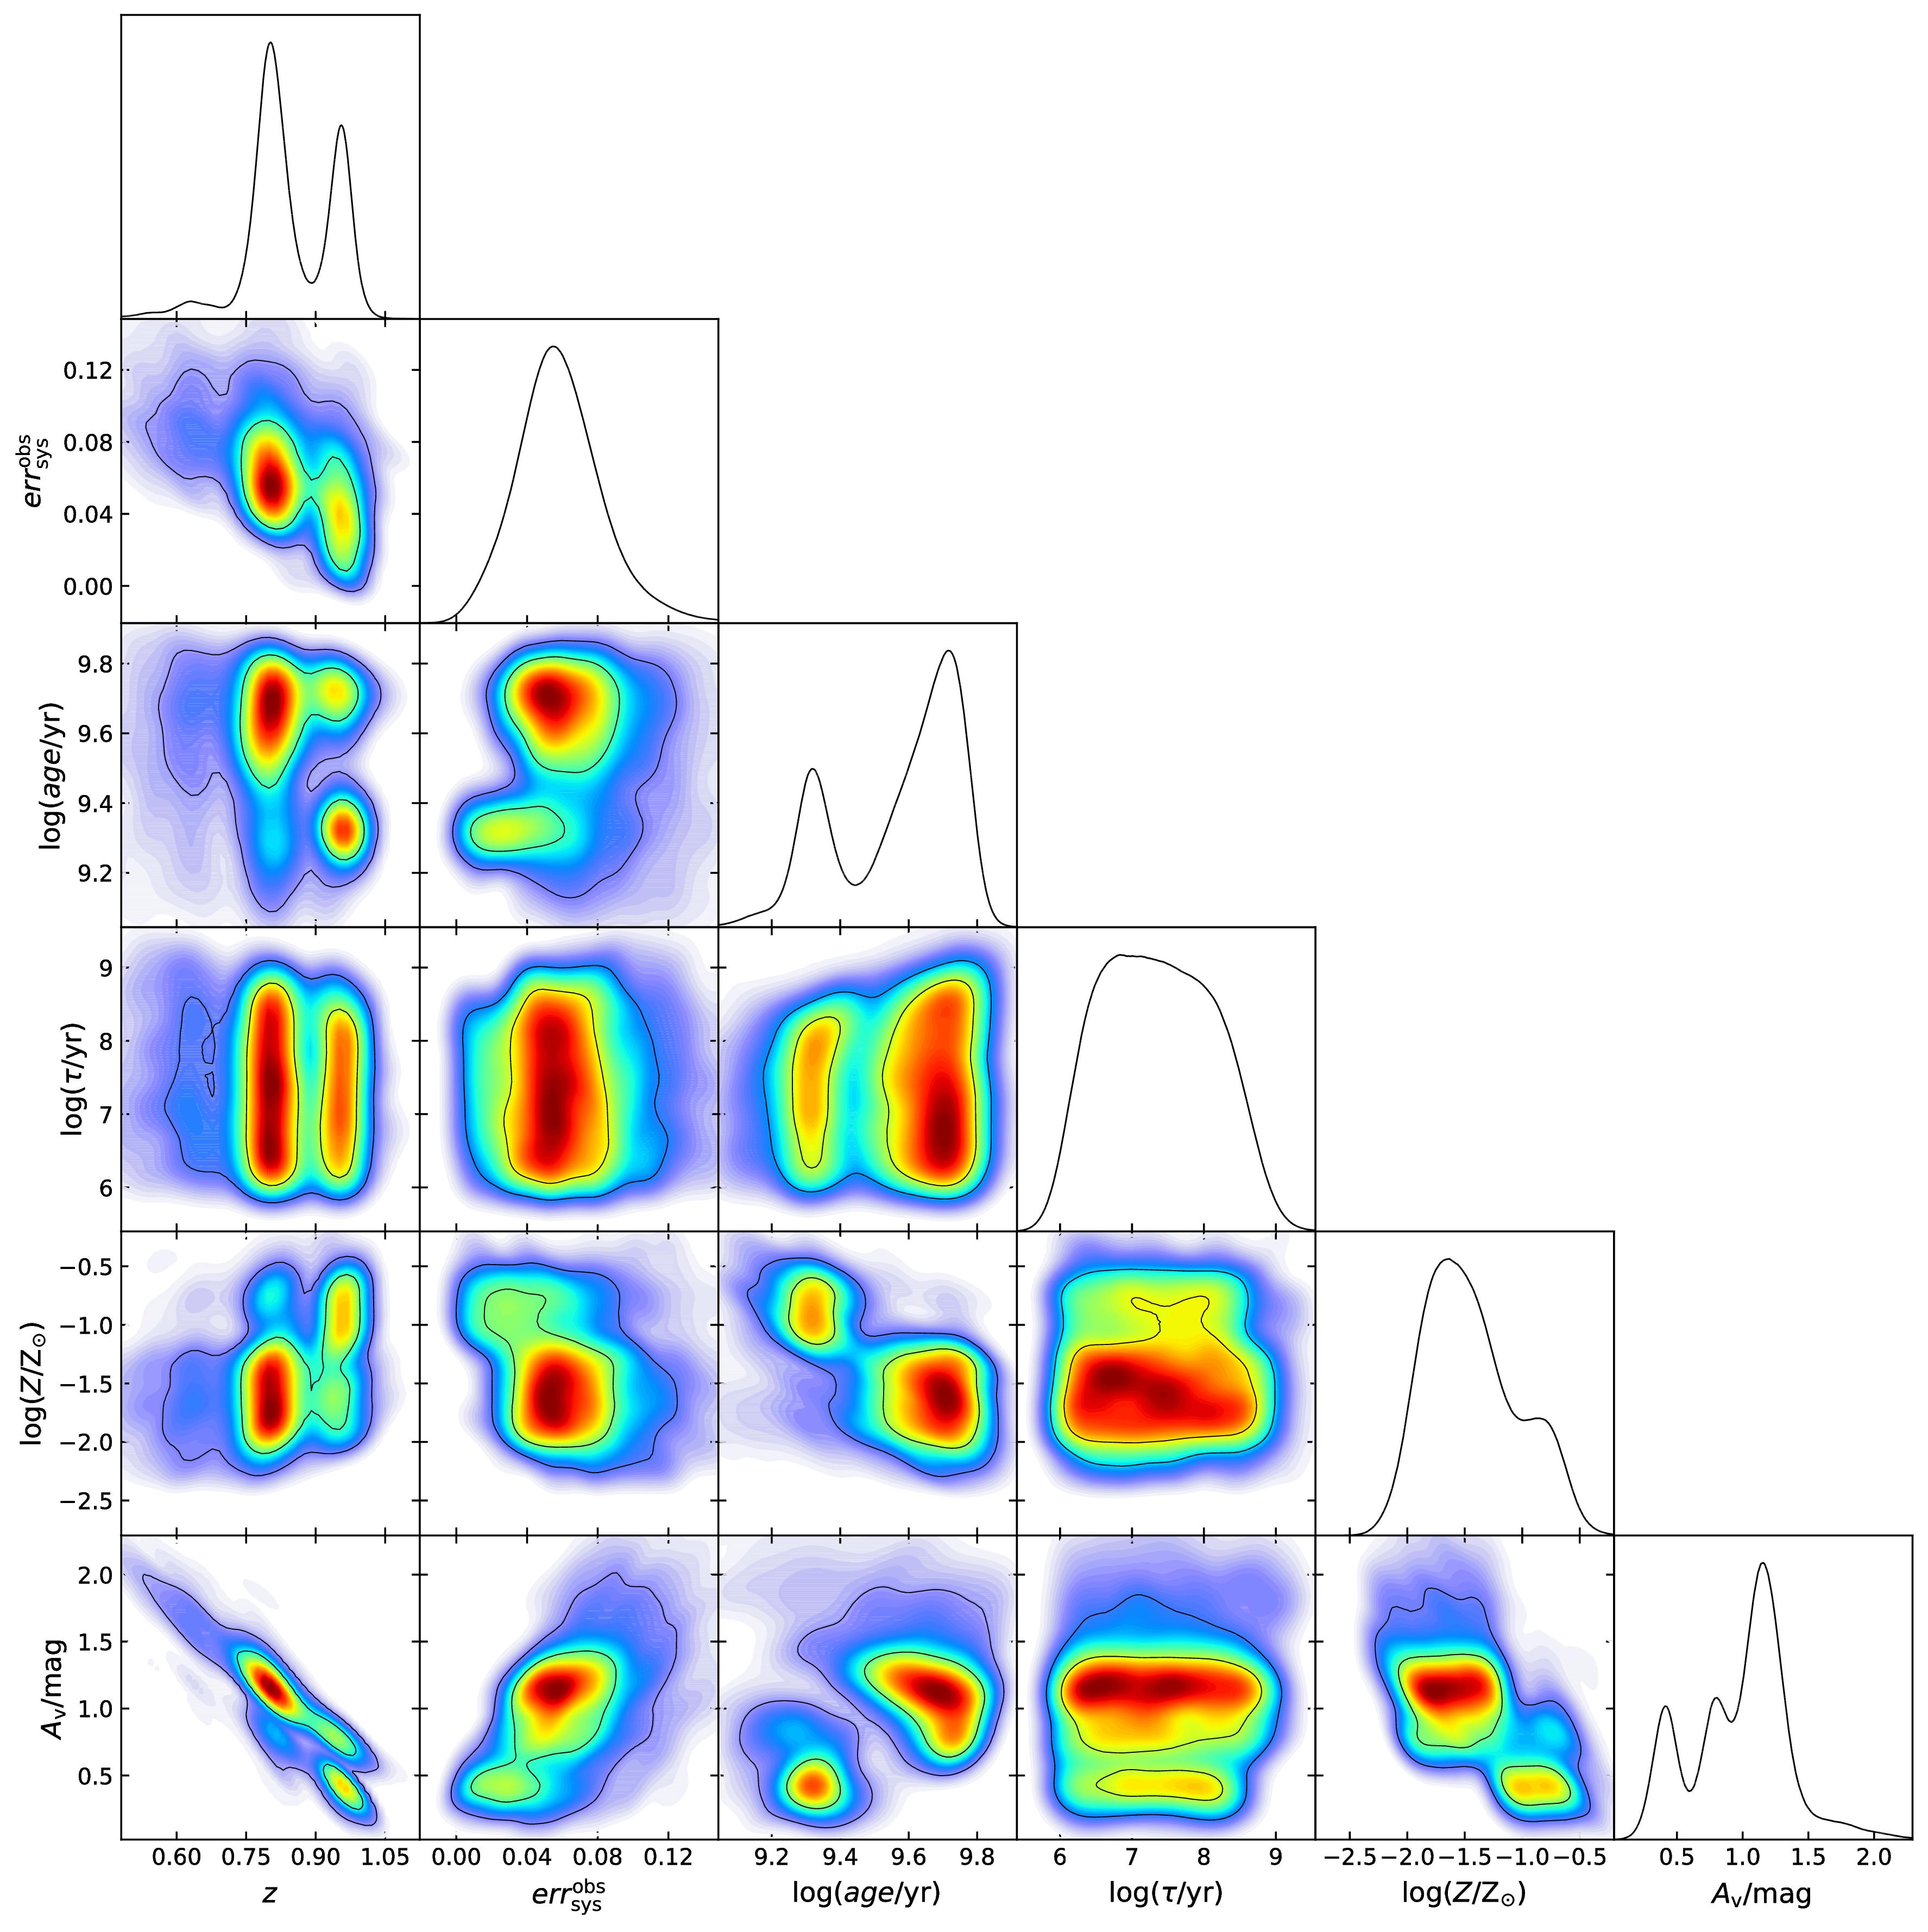
The 1 and 2-D posterior PDFs of free parameters for the PEG ULTRAVISTA114558. They represent our state of knowledge about them. The presence of multiple peaks and/or strong correlations in the 2D PDFs indicate the degeneracies between the free parameters of the SED model.
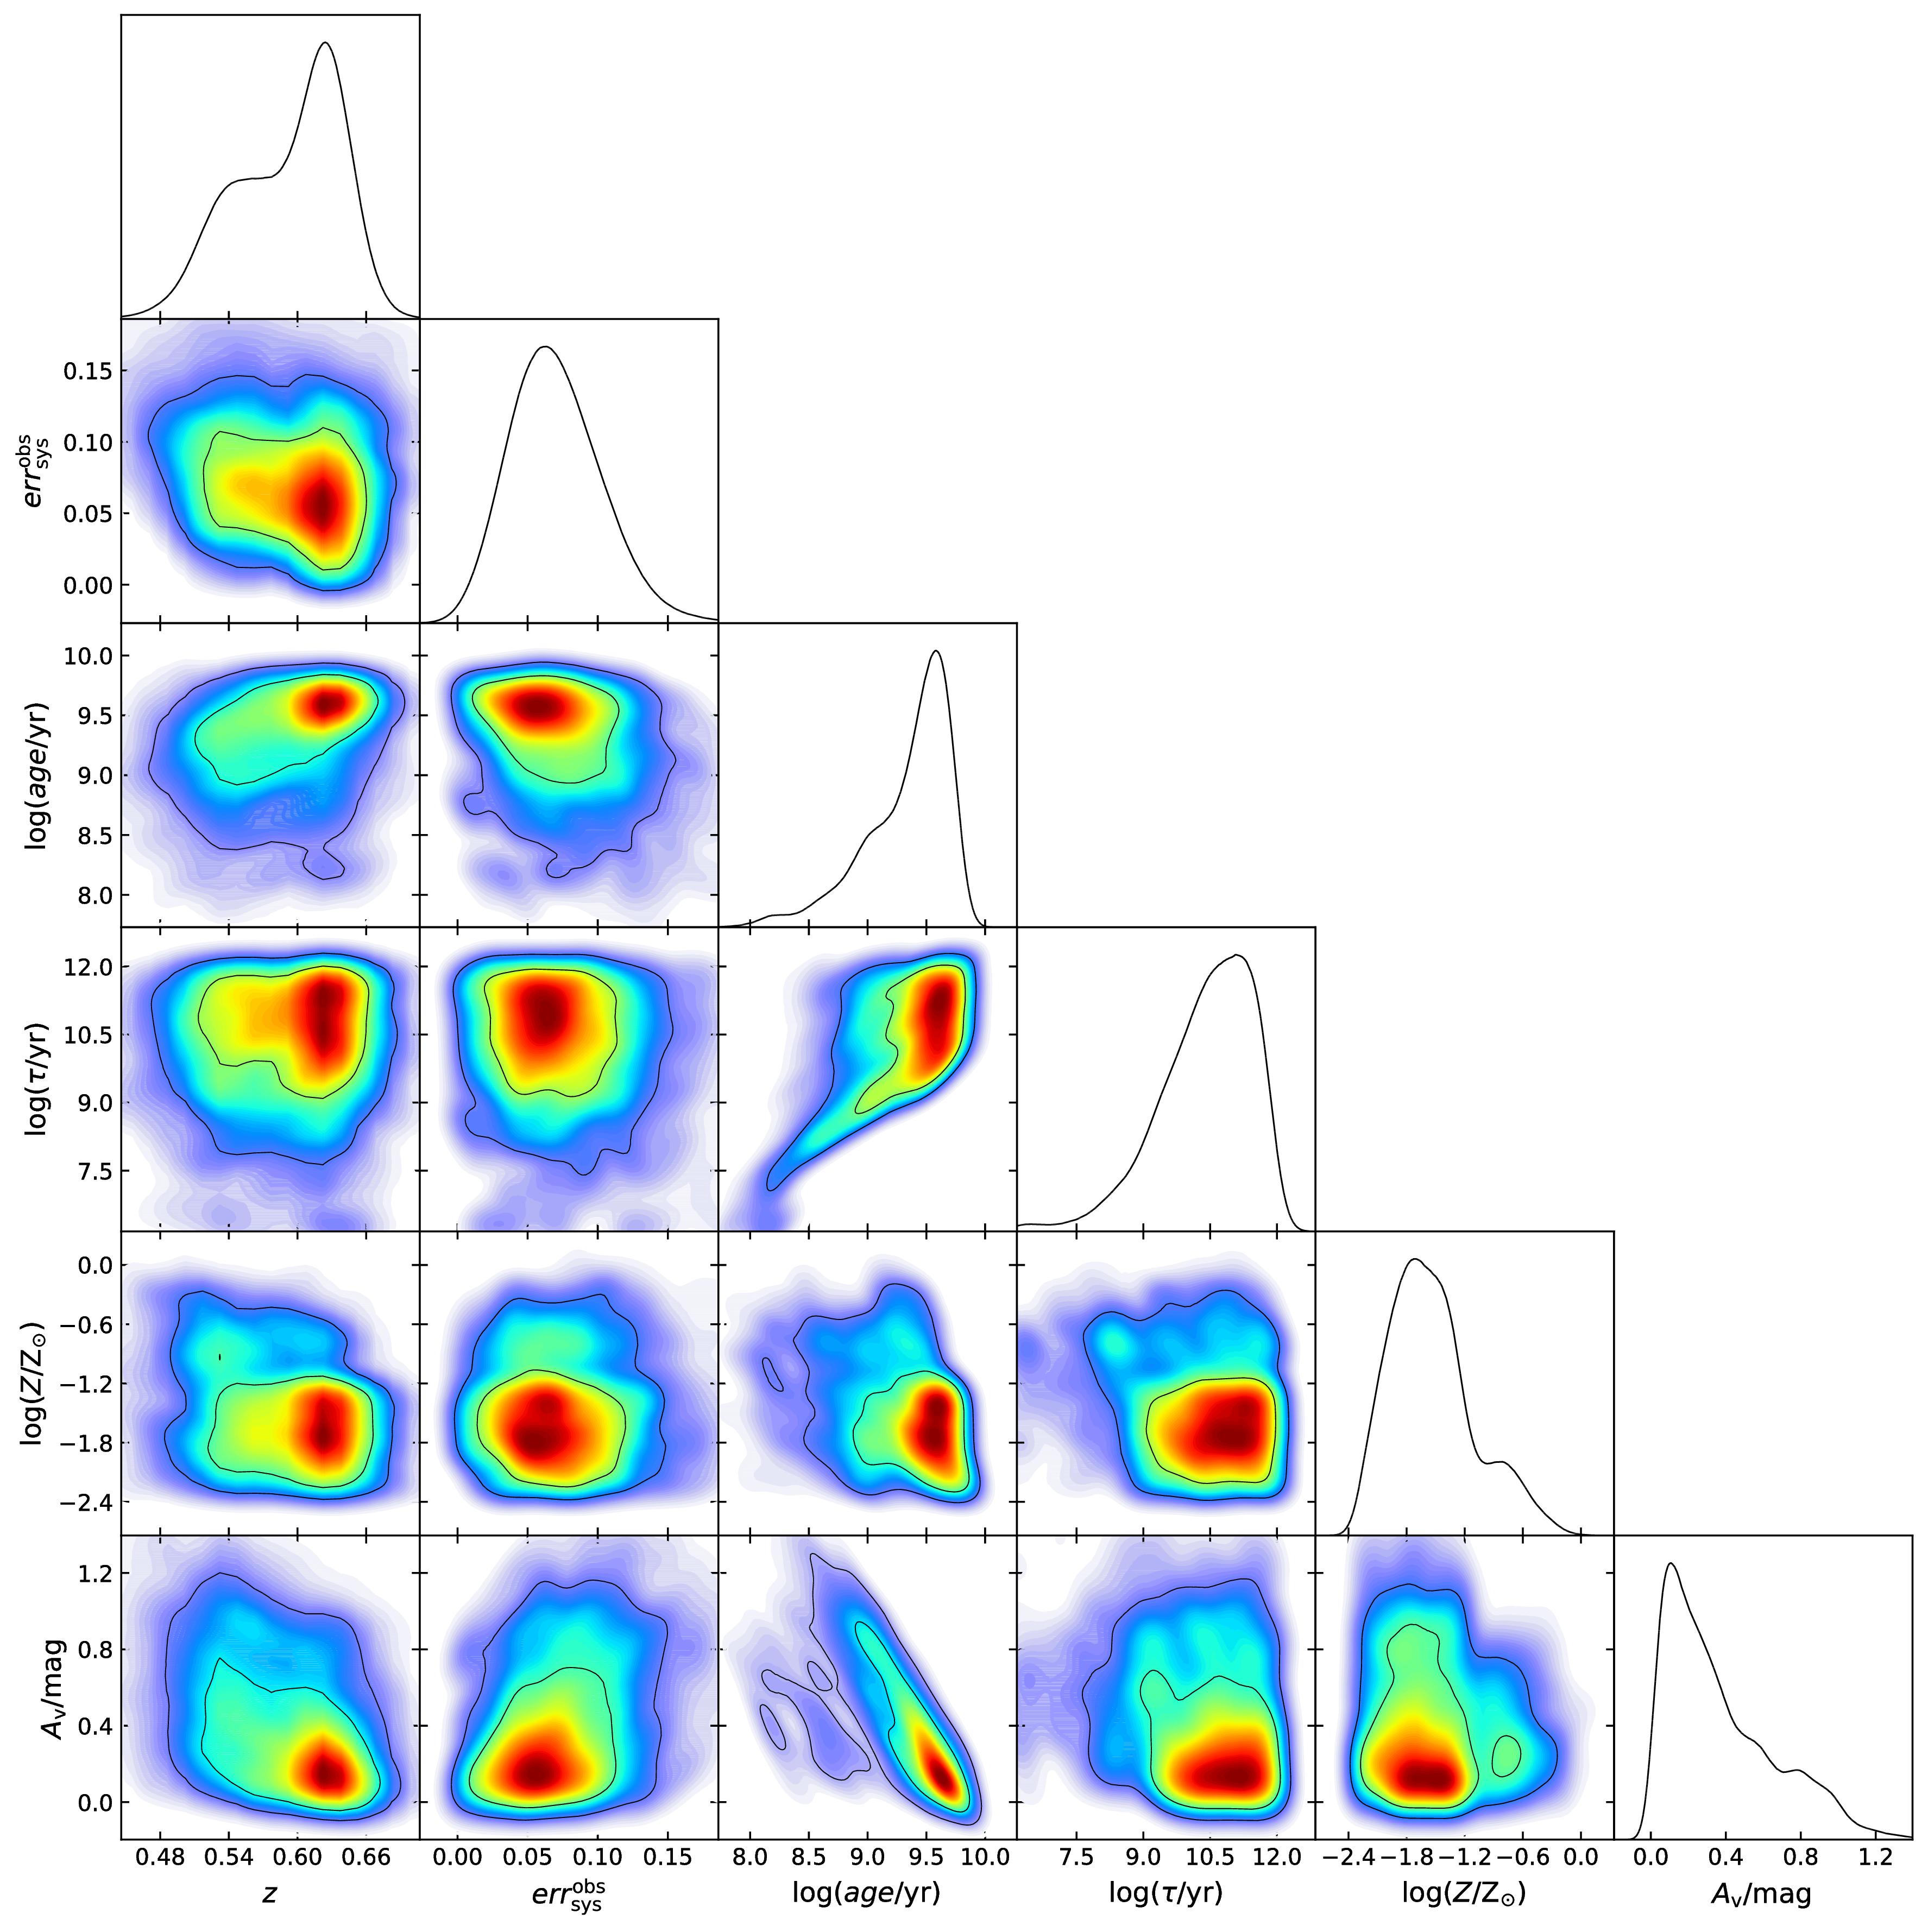
The 1 and 2-D posterior PDFs of free parameters for the SFG ULTRAVISTA99938. They represent our state of knowledge about them. The presence of multiple peaks and/or strong correlations in the 2D PDFs indicate the degeneracies between the free parameters of the SED model.
import getdist.plots as gplot
import os

analysis_settings = {'max_corr_2D': u'0.99', 'boundary_correction_order': u'1', 'converge_test_limit': u'0.95', 'smooth_scale_2D': u'0.3', 'credible_interval_threshold': u'0.05', 'contours': u'0.68 0.95 0.99', 'fine_bins_2D': u'400', 'num_bins': u'100', 'mult_bias_correction_order': u'1', 'fine_bins': u'3072', 'num_bins_2D': u'40', 'max_scatter_points': u'2000', 'range_ND_contour': u'-1', 'range_confidence': u'0.01', 'smooth_scale_1D': u'-1', 'ignore_rows': u'0'}
param_3d = None
params=[u'z', u'sys_err0', u'log(age/yr)[0,1]', u'log(tau/yr)[0,1]', u'log(Z/Zsun)[0,1]', u'A_v/mag[0,1]']
roots = ['10csp200_bc2003_lr_BaSeL_chab000_hyperz5_sample_par']

g=gplot.getSubplotPlotter(chain_dir=r'./test/ULTRAVISTA0/ULTRAVISTA114558',analysis_settings=analysis_settings)
g.settings.colormap = "jet"
g.settings.lab_fontsize=12
g.settings.axes_fontsize
g.triangle_plot(roots, params, plot_3d_with_param=param_3d, filled=False, shaded=True)
g.export("pdftreex.eps")

g=gplot.getSubplotPlotter(chain_dir=r'./test/ULTRAVISTA0/ULTRAVISTA99938',analysis_settings=analysis_settings)
g.settings.colormap = "jet"
g.settings.lab_fontsize=12
g.triangle_plot(roots, params, plot_3d_with_param=param_3d, filled=False, shaded=True)
g.export("pdftreey.eps")
3.2. run_HH2019
openmpi v1.8.8 is required for mpirun
./run_HH2019 160
#!/bin/bash
np=$1
id=$(date  +'%Y_%m_%d_%H_%M_%S')
for i in bc2003_lr_BaSeL_chab bc2003_lr_BaSeL_kroup bc2003_lr_BaSeL_salp cb2007_lr_BaSeL_chab cb2007_lr_BaSeL_kroup cb2007_lr_BaSeL_salp galev0_Kroupa galev0_Salpeter galev_Kroupa galev_Salpeter m05krr m05ssr ynIIs ynIIb BPASSv2_imf135_300b BPASSv2_imf135_300s
do
	for j in 4 5 6 7
	do
		for k in 0 1 2 3 5
		do
			echo "i=$i,j=$j,k=$k"
			time -p mpirun -output-filename $(pwd)/$id/log.$i.$j.$k -np $np ./bin/linux/bayesed --sampling 1,0,0,400,0.3,0.1,1000,-1e90,1,0,0,0,-1e90,100000,0.01 -i 0,observation/ULTRAVISTA/ULTRAVISTA0.txt --filters observation/ULTRAVISTA/filters.txt --filters_selected observation/ULTRAVISTA/filters_selected.txt --ssp 0,$i,1,3,1,0,0,0,0,0 --sfh 0,$k,0,0 --ext 0,$j --outdir result --sys_err_obs 0,1
		done
	done
done